Quick Start
설치
IBMap 를 사용하기 위해 아래 2가지 js 파일과 1개 css 파일을 include 합니다.
<!-- IBMap css 파일 -->
<script type="text/javascript" src="/css/ibmap.css"></script>
<!-- IBMap 라이선스 파일 -->
<script type="text/javascript" src="/ibleaders.js"></script>
<!-- IBMap 코어 파일 -->
<script type="text/javascript" src="/ibmap.js"></script>
IBMap 차트 객체 생성
차트 객체 생성은 차트가 만들어질 컨테이너가 구성된 이후에 설정 할 수 있습니다.
body 태그 하위에 컨테이너로 사용할 div를 생성 하고, body 태그의 onload 이벤트에서 생성함수를 호출합니다.
<주의> crate()함수 호출시 생성된 map 객체가 리턴됩니다.
- 객체 생성 방법
<!DOCTYPE html>
<html>
<head>
<script type="text/javascript">
// 일반적으로 사용 시
function initMapChart() {
    var ibmap = IBMapCharts.create('container');
}
</script>
</head>
<body onload="initMapChart();">
  <div id="container" style="width:500px;height:500px:"></div>
</body>
</html>
IBMap 맵 로드
차트 객체 생성 완료 후 geojson 규격을 기준으로 맵 차트를 구성합니다.
<!DOCTYPE html>
<html>
<head>
<!-- IBMap css 파일 -->
<script type="text/javascript" src="/css/ibmap.css"></script>
<!-- IBMap 라이선스 파일 -->
<script type="text/javascript" src="/softin.js"></script>
<!-- IBMap 코어 파일 -->
<script type="text/javascript" src="/ibmap.js"></script>
<script>
    function initMapChart() {
        var ibmap = IBMapCharts.create('container');

        ibmap.map.load({
            // 한국 지도의 geojson
        	url: "./map/kr/kr.json"
        });
    }
</script>
</head>
<body onload="initMapChart()">
      <div id="container" style="width:500px;height:500px:"></div>
</body>
</html>
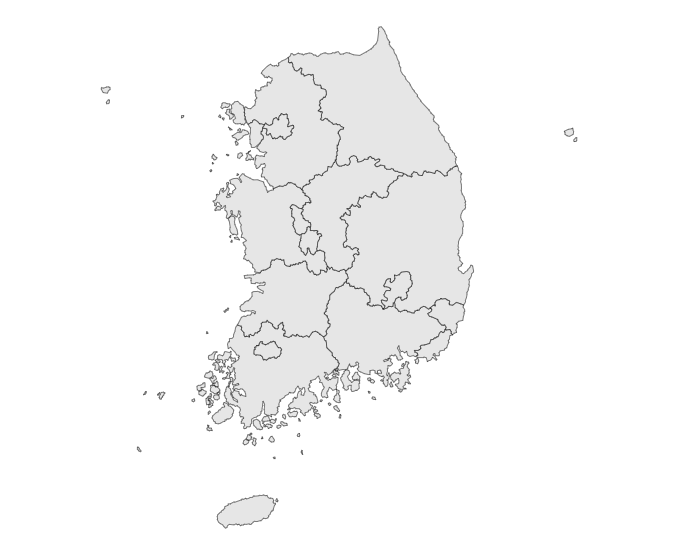
정상적으로 맵이 로드된 경우 아래와 같이 표시된다.
(geojson 에 따라서 지도 모양은 다름)