plotBands (xAxis properties)
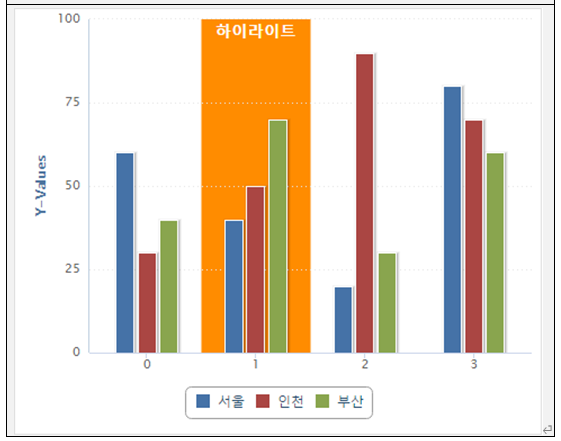
플롯밴드 속성 (특정영역 하이라이팅)을 설정 합니다.
Info
| name | type | required(default) | description |
|---|---|---|---|
| plotBands | object |
선택 | 플롯밴드 속성 |
| plotBands.from | number |
필수 | 시작점 |
plotBands.to |
number |
필수 | 종료점 |
| plotBands.color | color |
필수 | 색상 |
| plotBands.label | object |
선택 | 라벨 속성 |
- plotBands.label Info
| name | type | required(default) | description |
|---|---|---|---|
| text | string |
선택 | 라벨 문자열 표시할 문구 (예: "점검 구간") |
| textAlign | string |
선택 | 라벨 문자열 정렬 방법 값: "left", "center", "right" |
| align | string |
선택(center) | 좌우 정렬 방법 값: "left", "center", "right" |
| rotation | number |
선택(0) | 기울기 |
| useHTML | boolean |
선택(false) | html tag 사용 여부 |
| style | object |
선택 | 스타일 속성 |
- plotBands.label.style Info
| name | type | required(default) | description |
|---|---|---|---|
| color | color |
선택 | 폰트 색상 |
| fontSize | string |
선택 | 폰트 크기 CSS 크기 문자열 (예: "12px") |
| fontWeight | string |
선택 | 폰트 두께 CSS 글자 굵기 (예: "normal", "bold") |
Enum
- plotBands.label.align / plotBands.label.textAlign
| value | description |
|---|---|
| center | 중앙 정렬 |
| left | 좌측 정렬 |
| right | 우측 정렬 |
Example
myChart.setOptions({
  chart: {
    type: "column"
  },
  xAxis: {
    plotBands: {
      from : 0.5,
      to: 1.5,
      color: "#FF8C00",
      label: {
        text: "하이라이트",
        style: {
          color: "#FFFFFF",
          fontWeight: "bold",
          fontSize: "1.2em"
        }
      }
    }
  },
  series: [{
    name: "서울",
    data : [60,40,20,80]
  },{
    name: "인천",
    data : [30,50,90,70]
  },{
    name: "부산",
    data : [40,70,30,60]
  }]
}, {
  append: true,
  redraw: true
});
제공 버전
| version | desc |
|---|---|
| 7.3.0.0 |